Using wfdbtools
2013-06-15code
wfdbtools is a pure python module for accessing and using the waveform data in Physiobank. Provides rdsamp and rdann which are the python equivalents of the wfdb applications of similar names. A deliberate attempt is made to try to keep names and usage similar to the original wfdb applications for simplicity of use.
The only dependency that will need to be installed is numpy. However, to use the function plot_data, which is an utility function for interactive use, you need to have matplotlib also installed.
Example Usage:
:::python

from wfdbtools import rdsamp, rdann, plot_data
from pprint import pprint

# Record is a format 212 record from physiobank.
# Note that name of record does not include extension.
record  = 'samples/format212/100'

# Read in the data from 0 to 10 seconds
data, info = rdsamp(record, 0, 10)

# returned data is an array. The columns are time(samples),
# time(seconds), signal1, signal2
print data.shape
(3600, 4)

# info is a dictionary containing header information
pprint info
{'first_values': [995, 1011],
'gains': [200, 200],
'samp_count': 650000,
'samp_freq': 360,
'signal_names': ['MLII', 'V5'],
'zero_values': [1024, 1024]}

# And now read the annotation
ann = rdann(record, 'atr', 0, 10)

# ann has 3 columns - sample number, time (sec) and annotation code
print(ann[:4,:])
array([[  18.   ,    0.05 ,   28.   ],
           [  77.   ,    0.214,    1.   ],
       [ 370.   ,    1.028,    1.   ],
           [ 662.   ,    1.839,    1.   ]])


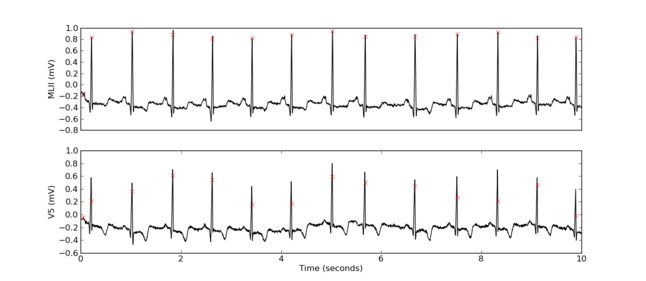
# Plot the data and the mark the annotations
plot_data(data, info, ann)
